Technology Excellence Week
Cloud, Security & Automation.
2020 Online Event - Click Here
Returning in 2021
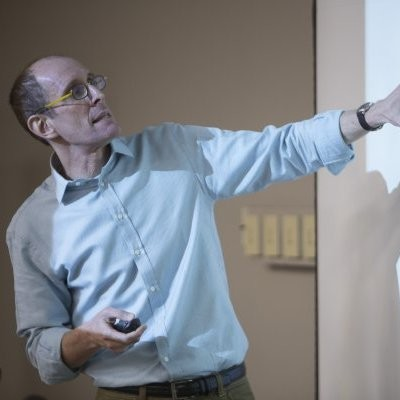
Daniel Markovitz
Founder, President Markovitz ConsultingPre-Conference Workshop Day
13:30 Workshop E: Measures of Success: Better Metrics, Better Management, Better Business Culture
Your technology generates tremendous amounts of data. How do you ensure that the data becomes useful information that enables you to improve your company, rather than the start of countless wild goose chases? Process Behavior Charts (PBCs) are the answer. This workshop will introduce PBCs, and show how they enable you to distinguish signal (significant changes) from noise (routine fluctuations) in the data you generate. As a result, you’ll stop overreacting to every up and down in your metrics, and you’ll keep employees from wasting time trying to figure out “What went wrong last week?” Finally, the workshop will present several fundamental lean tools that can help you begin to improve, in a proactive, systematic fashion, the underlying processes that are generating your metrics.
Topics covered:
- How to create process behavior charts
- How to properly interpret process behavior charts
- Why to avoid two daa point comparisons
- Data tables vs. charts
- Drawing the right conclusions
- Connecting charts to improvement activities
- Fundamental lean tools for continuous improvement
Check out the incredible speaker line-up to see who will be joining Daniel.
Download The Latest AgendaIn Partnership With:

QUESTIONS?
Address: IQPC Ltd, 129 Wilton Road,
London SW1V 1JZ
Telephone: 44 (0) 207 368 9300
Fax: 44 (0) 207 368 9301
Email: enquire@iqpc.co.uk

©2026 IQPC. All rights reserved.